
This post is part of my Home Decarbonisation Project.
I have a 19.3kWh BYD HVM home battery along with a 6.6kW solar panels, both connected to a Fronius Primo GEN24 5.0 Plus 5kW inverter. For more info on those, go see that other post. When the system was initially configured, everything was set to what I gather was a fairly standard configuration that charged the battery when there was excess solar, and consumption prioritised solar, then battery and finally grid energy, and that was that.
This configuration works well in the summer when there’s ample solar generation. However, winter charging has not been ideal. The battery was sitting at a fairly low state of charge (SOC) throughout the winter, most solar energy generated was directly consumed, and the solar production that did exist trailed off considerably as we got towards to early winter sunsets. This isn’t really a problem, other than how it interacts with my energy plan. I have a time of use (ToU) plan with the following tariffs:
| Tariff | Time of Day | Cost per kWh (AUD) | Cost per kWh Aug 2026 (AUD) |
|---|---|---|---|
| Solar Soak / Midday | 11:00 – 16:00 | NA | 0.18150 |
| Offpeak | 21:00 – 11:00 | 0.17270 | 0.22330 |
| Peak | 16:00 – 21:00 | 0.30250 | 0.40700 |
Those early winter sunsets fall in that peak energy pricing window, so the result is that solar was being directly consumed during peak generation with almost no benefit during the peak pricing window when it would be the most advantageous. After a long and drawn out back and forth with the solar installer, I finally gained ‘Technician’ access to the inverter, which allows more access to various settings for the inverter, solar, and battery.
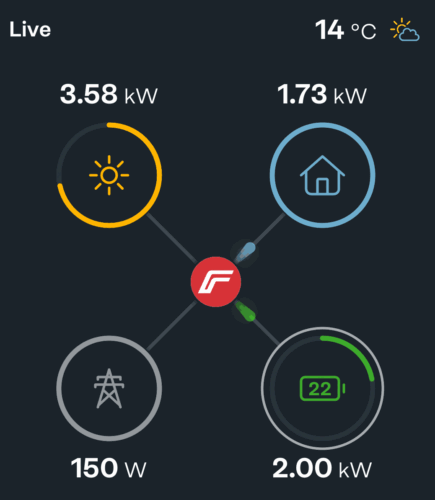
What did I change? I made one change to the battery management that enabled forced loading at a set rate for a set period each day. What this does in practice is force the battery to charge at a set rate regardless of solar production, which in this case will pull from the grid if there is insufficient solar production. Specifically, I have my system set to charge at a minimum of 2kW between 11:00 and 16:00. So, if there is 2kW or more solar production available to the battery, nothing changes. If there is less than 2kW of solar production available then the difference between the solar production and 2kW is pulled from the grid and sent to the battery. Solar production is both directly used by household demand and used to charge the battery, so factor in any direct usage that reduces available solar production. Eg. If the solar system is generating 700w on a rainy Melbourne winter day at 12:30, then that 700w goes into the battery along with 1.3kW pulled from the grid (plus any household demand) and the inverter adjusts these levels thought the forced loading window to maintain a 2kW charge rate. The example below shows a sunnier view with only 150W being pulled from the grid.
Why this time window at this rate? Let’s begin at the end. The time window ends at 16:00 because that is when peak pricing begins, and I want the battery SOC at its peak at the beginning of the higher peak pricing. The 11:00 start time is set because it usually aligns with a reasonable level of solar production as well as the discounted ‘solar soak’ pricing from Globird. Additionally, the five hour period between 11:00 and 16:00 allows my 5kW inverter to charge the battery at a minimum of 2kW which results in adding roughly 50% to the SOC; 2kW x 5.0 hours = 10kWh, and 10kWh / 19.3kWh = 0.518 ≈ 52% SOC. A 50% SOC was chosen because it leaves significant overhead for any additional solar production that occurs after 16:00, any left over SOC from the previous day, and 10kWh is generally more than enough to get through the daily peak pricing period.
That last point, 10kWh, is key. While the charge window and rate have their own reasoning behind them and 10kWh is apx. 50% SOC, more importantly this 10kWh enough to get through the peak pricing period which maximises the benefits of time shifting grid energy use. Considering this, you really have to start with a system that’s designed for your needs to let this work efficiently. If you have a battery that’s too small to get you through the peak pricing window you’ll miss out on some portion of the cost savings, or you’ll export solar production to the grid when your battery reaches capacity (100% SOC). If you don’t have enough solar generation / inverter capacity, then you may have to set your minimum charging rate higher or the charge window larger than ideal and you might favour grid-sourced energy over your own. In summary, my calculations worked out for my system and my needs, but this isn’t a one size fits all situation.
What about decarbonisation? Wasn’t that the whole point? Another consideration is the source of the grid energy charging the battery. I could charge the battery anytime, including over night when the grid demand is low. However, that would more or less guarantee a higher level of energy produced from fossil fuels as wind and hydro power in Victoria wouldn’t be supplemented by solar overnight. You can check out OpenNEM for real time and historic data. Furthermore, the 11:00 – 16:00 window also includes the various free energy windows that were designed to promote energy usage when there is generally excess solar generation available. A prime example is very likely the motivation behind the Solar Soak pricing below the overnight offpeak introduced by Globird on 1 August 2026. Taking a step back, time shifting demand on the grid away from peak usage periods reduces the need for the fossil fuel energy generation that supplements wind, hydro, and solar in Victoria. So, aligning the battery force loading with solar generation is beneficial not only for my own solar production, but grid solar production (and at lower costs per kWh) as well, all of which are positive steps towards decarbonisation.
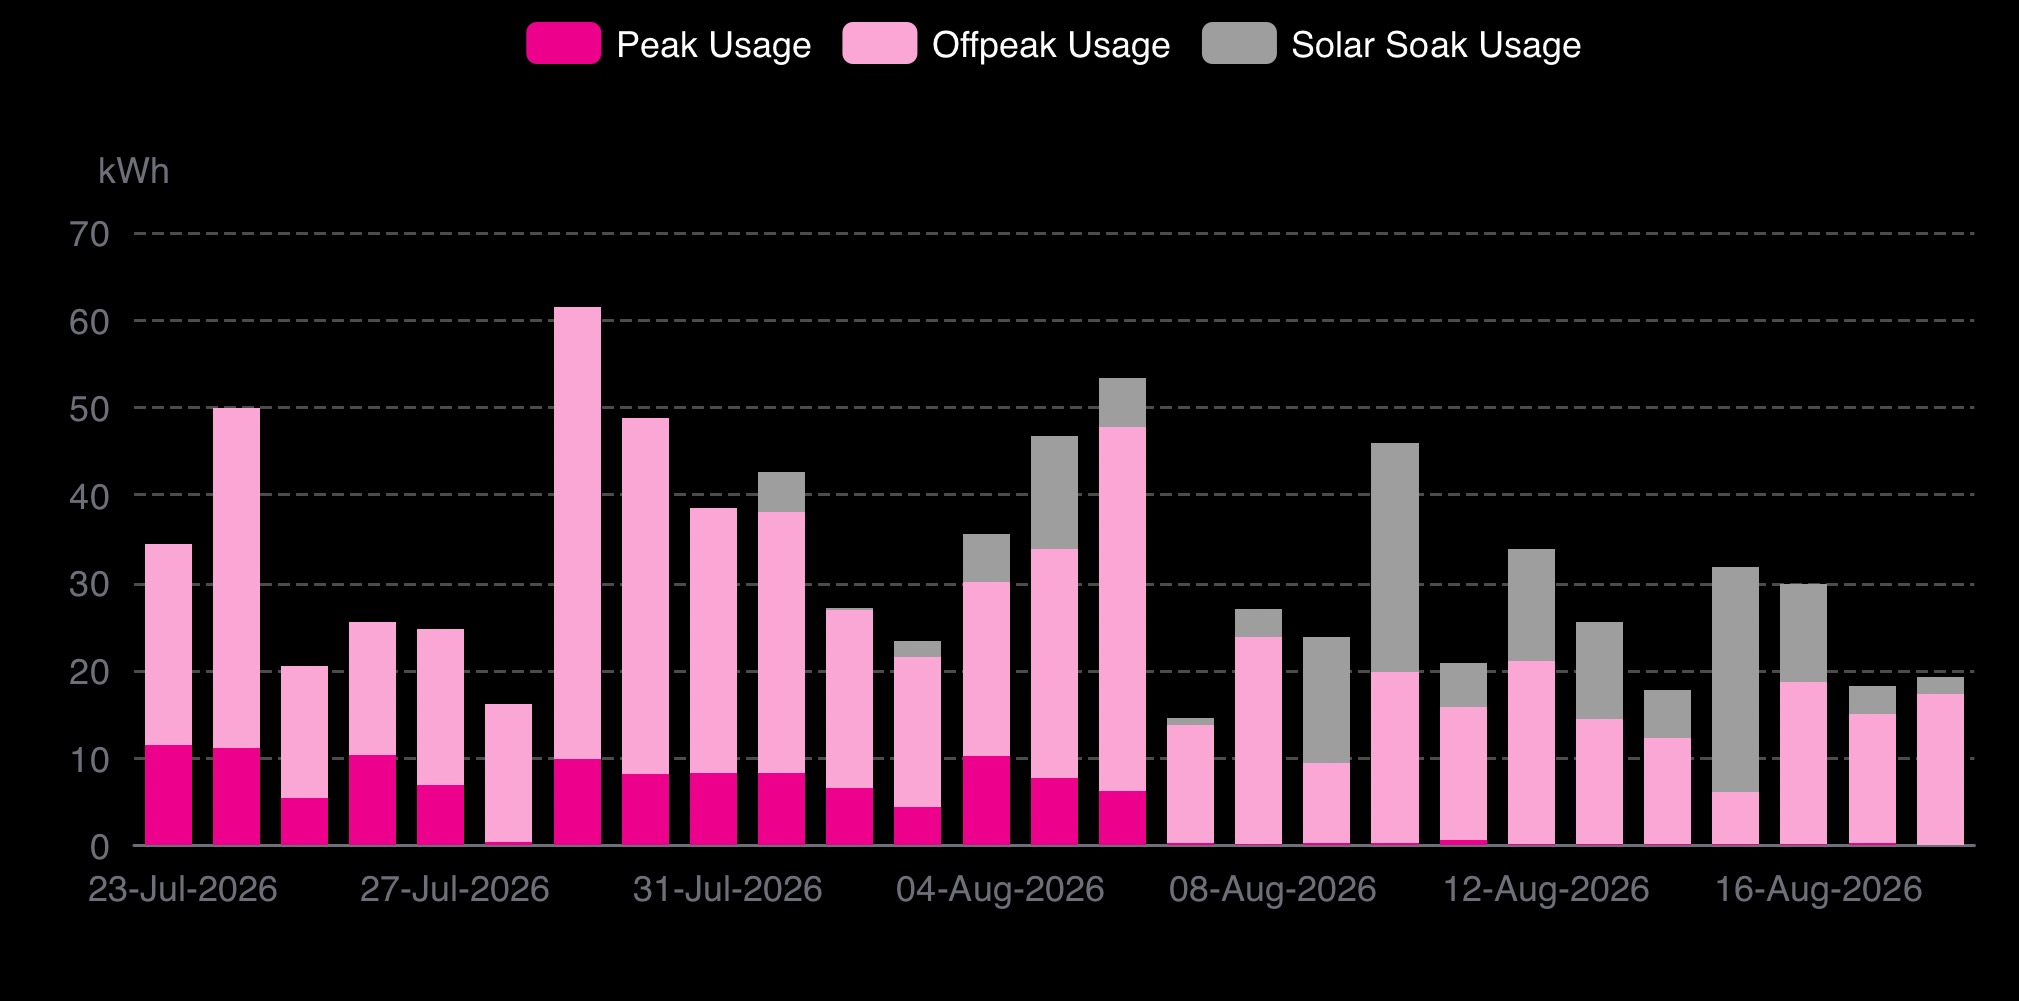
Did it work? I’ve been running the system with this configuration for a couple weeks and our peak energy consumption has gone from a very roughly 8-11kWh per day to none (aka 0kWh). The scheduled forced loading began on 8 August 2026, which is where the peak usage stops on the chart above. Looking at this chart we can also see that overall energy use is declining and solar production is increasing. Keep in mind that we’re comparing periods where there are at least three major confounders occurring: solar production is increasing, the solar production window is widening, and winter temperatures are moderating. I addition to that, we have two EVs, and they heavily skew the data whenever they’re charged, which tends to be sporadic and infrequent, but never between 16:00 and 21:00. So, there’s probably not a whole lot we can read into these data at the moment. A better comparison might be to revisit peak energy use after next winter and compare larger time periods spanning comparable months.
What about when spring and summer arrive? As discussed earlier, the energy source charging the battery during the window should dynamically adjust with solar production and will probably result in no energy being pulled from the grid on most summer days. But, I’m going to keep an eye on it and disable this forced loading schedule during the summer and autumn months if the battery is at capacity too early in the day and if a lot of evening solar production is going back to the grid.
Any other considerations? We need to think about the estimated losses due to inefficiencies in the system. Storing grid energy in a home battery and reusing it later isn’t free. There are losses along the way, those losses reduce the benefit, and it’s a good idea to think about these costs when one of the primary reasons for time shifting grid energy use is financial. If we assume the round trip efficiency of storing energy in the battery sourced during solar soak pricing and reusing in the evening is between 85% and 90%*, then the cost of storing and then deploying during peak pricing is 4-6c per kWh, all of which is far less than the 22.55c per kWh peak pricing premium over the solar soak rate. In useful terms, the estimated benefit of all of this is 16-19c/kWh. I’d call that a win and makes this whole exercise worthwhile.
*- This is outside of my area of expertise and these estimated efficiencies are an intentionally large window. It might be inaccurate, but I think there’s a high likelihood that the actual number is usually somewhere in this window.
How can you use any of this? Well, I think you could estimate your peak usage, charge over a time period that overlaps significantly with your solar production at a rate that will approximate your peak usage leaving enough SOC headroom for solar storage, and assuming none of these calculations divides by zero, see what happens.
Update, 22 August 2026: Batteries send power prices up in midnight charging mystery Just for the record, I had nothing to do with this. While in the process of setting up my forced loading schedule I did charge my battery once overnight on 7 July 2026, that was in a different state and a week earlier. I know tone doesn’t always translate here, and this is obviously absurd and said in jest. But, an interesting story nonetheless.
Update 26 August 2026: I corrected the energy tariff rates from Globird to align with their changes from 1 August 2026 and updated the calculations
More Updates? I plan to revisit this in about a year’s time, which will be August/September 2027.
Leave a Reply