
What is the Home Decarbonisation Project? This project began many years ago, was documented in an exhaustive blog post, and I’ve continued sharing my thoughts and updates in a growing series of posts. Here, in the Home Decarbonisation Project, I have organised all of this into a structured project that links out to all of my related content.
Why? The original post contains some background with information about the interview that was the motivation for writing all of this and I go into further detail for my motivation and reasoning in the Why did I do this? section of the Decarbonising Home post.
Over the past several years I’ve been working on a deliberate plan to decarbonise whatever I can, wherever I can. Why? My primary reason is to minimise my own environmental impact, a close second is to reduce my financial support and reliance on businesses, industries, organisations and governments who promote and produce fossil fuels.
What else? I’ve also included an overall summary looking back at all of the steps with comparisons, analysis, and distractions and attempted to answer a few questions about the process and steps.
So, what does all this tell us? …a more nuanced interpretation would be that split systems are a cost effective way to heat and cool a small area, the Tesla Wall Connector is a relatively inexpensive EV charger that usually works, and EVs, like all cars, are generally not a cost effective nor are they good value.
Phases? This process is divided into three phases, with the phase 1 encompassing the initial electrification process, phase 2 was the process of implementing the timing of energy use with all of these electrified devices and appliances, and now phase 3 is maintenance and continued adaptation to changing conditions.
Phase 1: Electrification
A necessity of a decarbonised home is the removal or replacement of fossil fuels. The timeline of this process is extensively documented in Decarbonising Home, a single post that probably should have been at least half a dozen, which includes the electrification of all fossil-fuelled home appliances as well as transport and additional steps towards decarbonisation.
Cost
Value
Difficulty
Effect
So, what does all this tell us? The most cost effective steps are to get a split system, a Tesla Wall Connector and an eBike, and probably best to stay away from EVs. Or, maybe this tells us to look beyond statistics alone and think a little more about what the data actually say, what questions they can actually answer, and the context. The measures above aren’t all equal and their weights aren’t necessarily reflected in the data. I think a more nuanced interpretation would be that split systems are a cost effective way to heat and cool a small area, the Tesla Wall Connector is a relatively inexpensive EV charger that usually works, and EVs, like all cars, are generally not a cost effective nor are they good value.
Phase 1 omni-post
Select a specific step in the decarbonisation and electrification process
- Heatpump clothes dryer A first step. LG Heat pump clothes dryer
- Tesla Model 3 A big step. Replacing the 2004 Toyota Prius with a 2021 Tesla Model 3 SR+.
- Ducted Heat pump heating and cooling A Necessary step. Replacing the old gas heat with a ducted heat pump.
- eBike An unplanned step. Adding a 2022 Giant/Momentum Transcend ebike.
- Solar A key step. Adding 6.6kW of solar panels and a 5.0kW Fronius inverter.
- Heat pump water heater An intermediate step. Replacing a gas water heater with a Sanden heat pump.
- Nissan Leaf An impulsive step. Replacing the much-loved 2008 Subaru Liberty wagon with a 2020 Nissan Leaf.
- Induction cooktop A step I should have taken years ago. Replacing a gas cooktop with a Bosch induction cooktop.
- Abolishing gas A likely irreversible step.
RemovingAbolishing the gas supply to the house. - Home battery An expensive step further. Adding a 19.3 kWh BYD HVM LFP house battery.
- Extras:
- Main switchboard upgrades Accomodating modern electrification in 1970s infrastructure
- Workshop split system Cheap and effective climate control
- Tesla charger A relatively inexpensive EV charger that usually works
- Electric lawn mower The other cord cutter
Phase 2: Timing
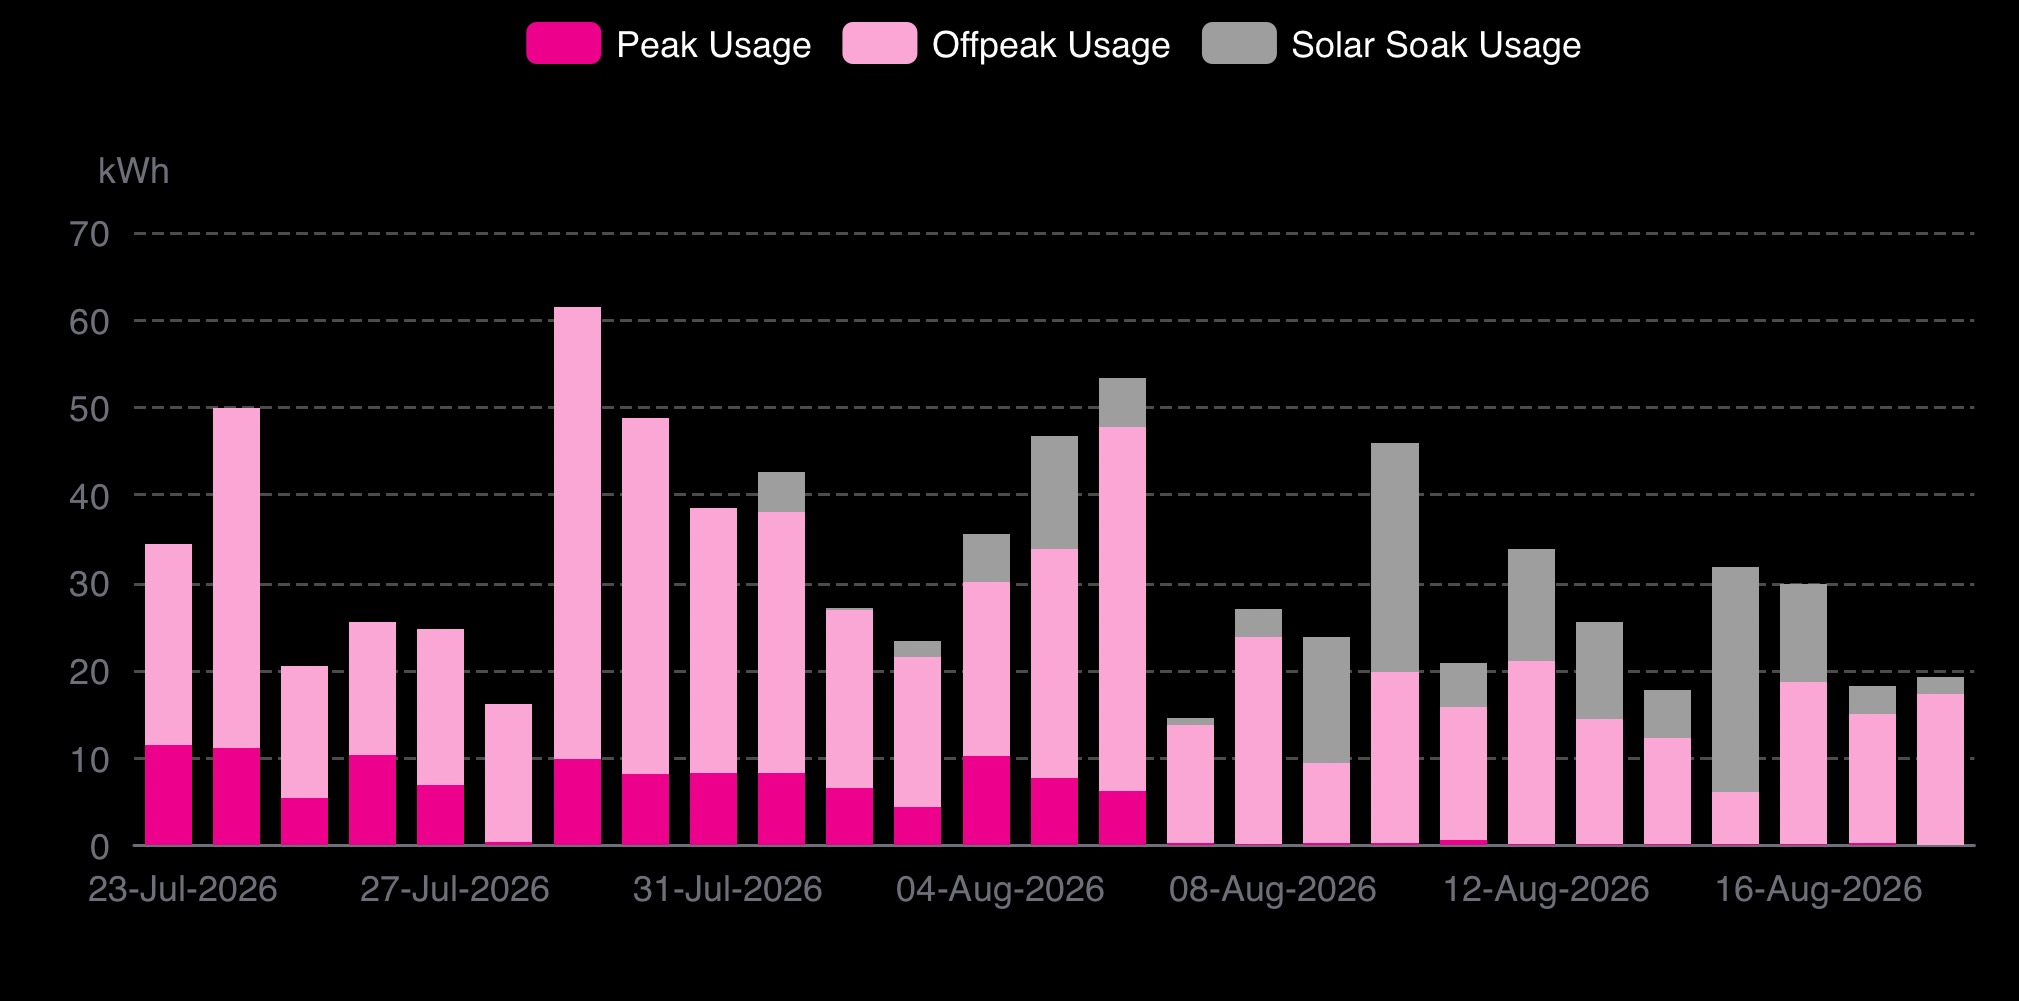
The cost of energy varies throughout the day due to time of use (ToU) energy plans, and this cost acts as a signal for energy demand on the grid which is directly related to renewable energy generation. This cost was a key consideration throughout phase 1, and can be further addressed through well thought out configuration and setup now in phase 2. Considering the substantial increase in the overall amount of electricity needed to run all of these electrified systems implemented in phase 1, timing their use can have a large impact on the utilisation of both directly-consumed solar and stored battery energy. With the right timing, we can improve our own solar and battery utilisation, but also maximise the use of gird renewables which both promotes decarbonisation and minimises costs.
ToU pricing and electricity demand in Australia
A time-of-use tariff against the shape of a typical demand day
Hover to show time of day and click a series in legend to show/hide.
Show source data
| Tariff | Time of Day | Cost (AUD) |
|---|---|---|
| Daily Charge | 1.133 / day | |
| Solar Soak | 11:00 – 16:00 | 0.1815 / kWh |
| Offpeak | 21:00 – 11:00 | 0.22330 / kWh |
| Peak | 16:00 – 21:00 | 0.40700 / kWh |
Usage and daily supply rates include GST. Rates shown are before any conditional discount.
Indicative demand is not measured system demand. It is the shape of the VIC wholesale spot price for Q4 2024, the year before grid-scale batteries flattened it (see the companion cost-comparison chart), normalised to its own range: 0% at the day’s lowest 5-min average, 100% at its highest. Wholesale price and demand are not equivalent; price also reflects supply-side conditions (eg. rooftop solar), which is why prices can go negative when demand still exists. But I’d argue they’re similar enough for the shape of this curve to stand in for a typical demand day. What do you think?
Sources. Wholesale prices: AEMO, Quarterly Energy Dynamics — Q4 2024 , Figure 14 “Average regional energy price by time of day,” Victoria series, read from the report’s own chart data (published January 2025). Rates: GloBird Energy Boost from 1 August 2026, at crossgeared.com/time-of-use-energy-plans.
Solar is modelled using clear-sky global horizontal irradiance computed from solar geometry for Melbourne, Australia (37.81°S, 144.96°E) on the 15th of each month, averaged hourly and scaled. Times displayed are local Melbourne time, and the change from AEST to AEDT shifts the relative curve location. This solar visualisation represents sunlight falling on a horizontal surface and is not directly corerlated to the output of rooftop solar, but I think it’s a pretty good visual indicator of how much output you might expect from your system.
Below are the posts related to decarbonisation phase 2. Those in colour are published and accessible while the remainder will give you some insight into what I may be discussing next.
Phase 2 posts
Phase 3: Adaptation
I am currently in phase 3 of my decarbonisation process, which includes maintenance and continued adaptation to changing conditions. Most of my future updates will land here, and I expect this to be an ongoing process. As before, the posts below in colour are published and accessible while the remainder will give you some insight into my upcoming updates.
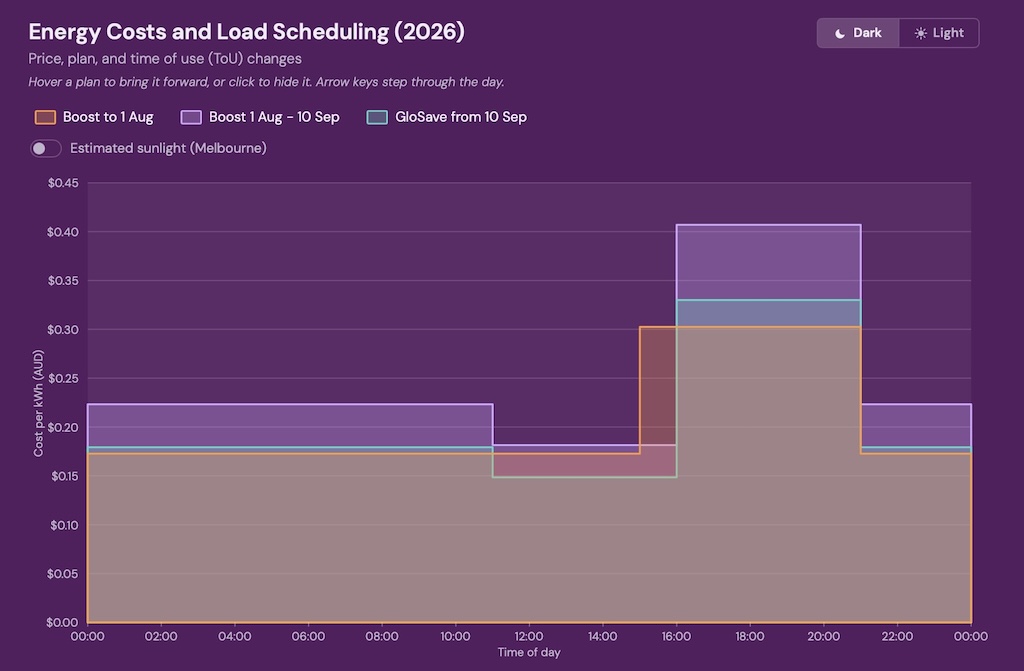
Energy Costs and Load Scheduling (2026)
Price, plan, and time of use (ToU) changes
Hover a plan to bring it forward, click to show/hide. Arrow keys step through the day.
Feed-in Tariff
Export rates are the same across all GloBird Boost and GloSave plans. These rates are displayed with a zoomed-in scale as they would otherwise not be detectable to the human eye. Use the zoom feature below to get a more realistic (honest) view of how small they really are.
Scheduled Loads
Hover over a scheduled load time window for details and show load on ToU plot.
Show source data
| Tariff | Time of Day | Cost (AUD) |
|---|---|---|
| Daily Charge | 1.1660 / day | |
| Offpeak | 21:00 – 15:00 | 0.17270 / kWh |
| Peak | 15:00 – 21:00 | 0.30250 / kWh |
| Tariff | Time of Day | Cost (AUD) |
|---|---|---|
| Daily Charge | 1.133 / day | |
| Solar Soak | 11:00 – 16:00 | 0.1815 / kWh |
| Offpeak | 21:00 – 11:00 | 0.22330 / kWh |
| Peak | 16:00 – 21:00 | 0.40700 / kWh |
| Tariff | Time of Day | Cost (AUD) |
|---|---|---|
| Daily Charge | 0.86427 / day | |
| Solar Soak | 11:00 – 16:00 | 0.144045 / kWh |
| Offpeak | 21:00 – 11:00 | 0.179321 / kWh |
| Peak | 16:00 – 21:00 | 0.3201 / kWh |
| Tariff | Time of Day | Cost (AUD) |
|---|---|---|
| Solar/Generation Feed in (4pm-9pm) | 16:00 – 21:00 | 0.03000 / kWh |
| Solar/Generation Feed in (9pm-10am, 2pm-4pm) | 21:00 – 10:00, 14:00 – 16:00 | 0.00100 / kWh |
| Solar/Generation Feed in (10am-2pm) | 10:00 – 14:00 | 0.00000 / kWh |
Daily supply charge Boost to 1 Aug: $1.16600, Boost 1 Aug - 10 Sep: $1.13300, GloSave from 10 Sep: $0.86427.
Solar is modelled using clear-sky global horizontal irradiance computed from solar geometry for Melbourne, Australia (37.81°S, 144.96°E) on the 15th of each month, averaged hourly and scaled. Times displayed are local Melbourne time, and the change from AEST to AEDT shifts the relative curve location. This solar visualisation represents sunlight falling on a horizontal surface and is not directly corerlated to the output of rooftop solar, but I think it's a pretty good visual indicator of how much output you might exepect from your system.
Phase 3 posts
All Home Decarbonisation Project Posts in Chronological Order
These are all of my posts, updates and any other content related to my home decarbonisation project. All of these items should be accessible from their corresponding phase above, that is assuming I've stayed on top of things and haven't forgotten anything.
-
Tesla Wall Connector V3
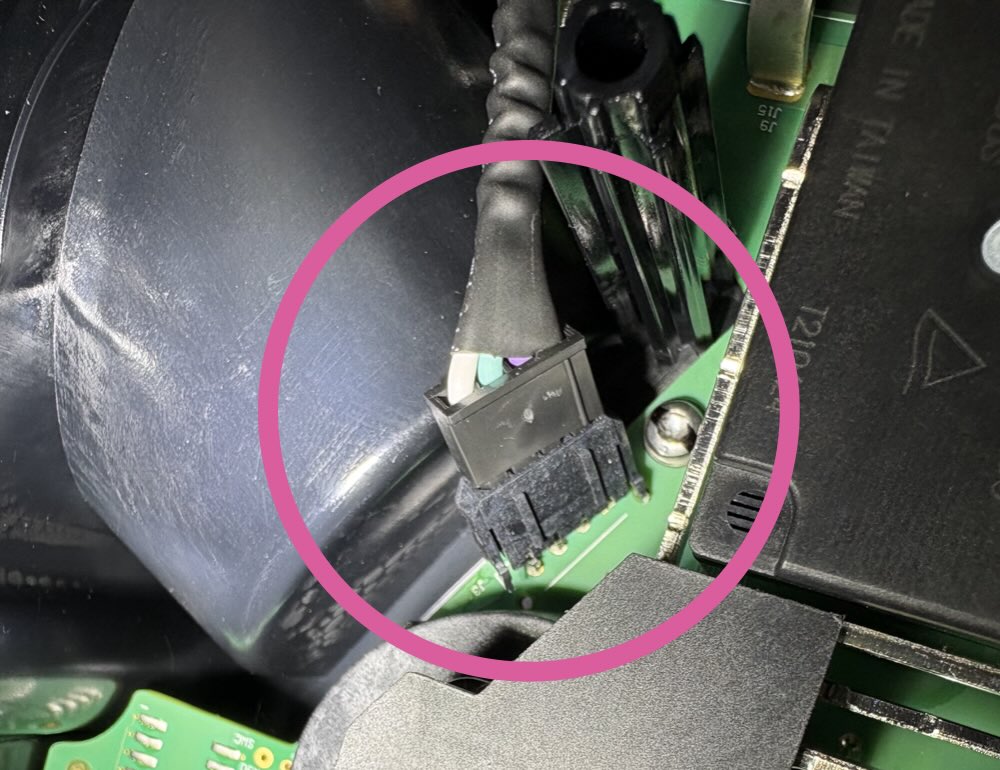
I recently had a recurring error CC_a027 from my Tesla Wall Connector V3 that would give three red error LED blinks, send a notification of a charge error to my phone and the in-car display, and reduce the charge rate from whatever to was set to down to 6A. My Wall Connector was about six…
-
Decarbonising Home
Sections A little background An interview that was the motivation for writing all of this Why did I do this? The reasons why I decarbonised my home A few notes Notes on the creation of this piece What did I do? A brief overview of what I did When did I do it and how…
-
Battery Management
I have a 19.3kWh BYD HVM home battery along with a 6.6kW solar panels, both connected to a Fronius Primo GEN24 5.0 Plus 5kW inverter. For more info on those, go see that other post. When the system was initially configured, everything was set to what I gather was a fairly standard configuration that charged…
-
Time of Use Energy Plans
Timing is everything. The cost of electricity has been a key factor throughout the decarbonisation process. The cost of energy varies (read: increases) over time, but is also variable throughout the day due to time of use (ToU) energy plans. Considering the substantial increase in the overall amount of electricity needed to run all of…
-
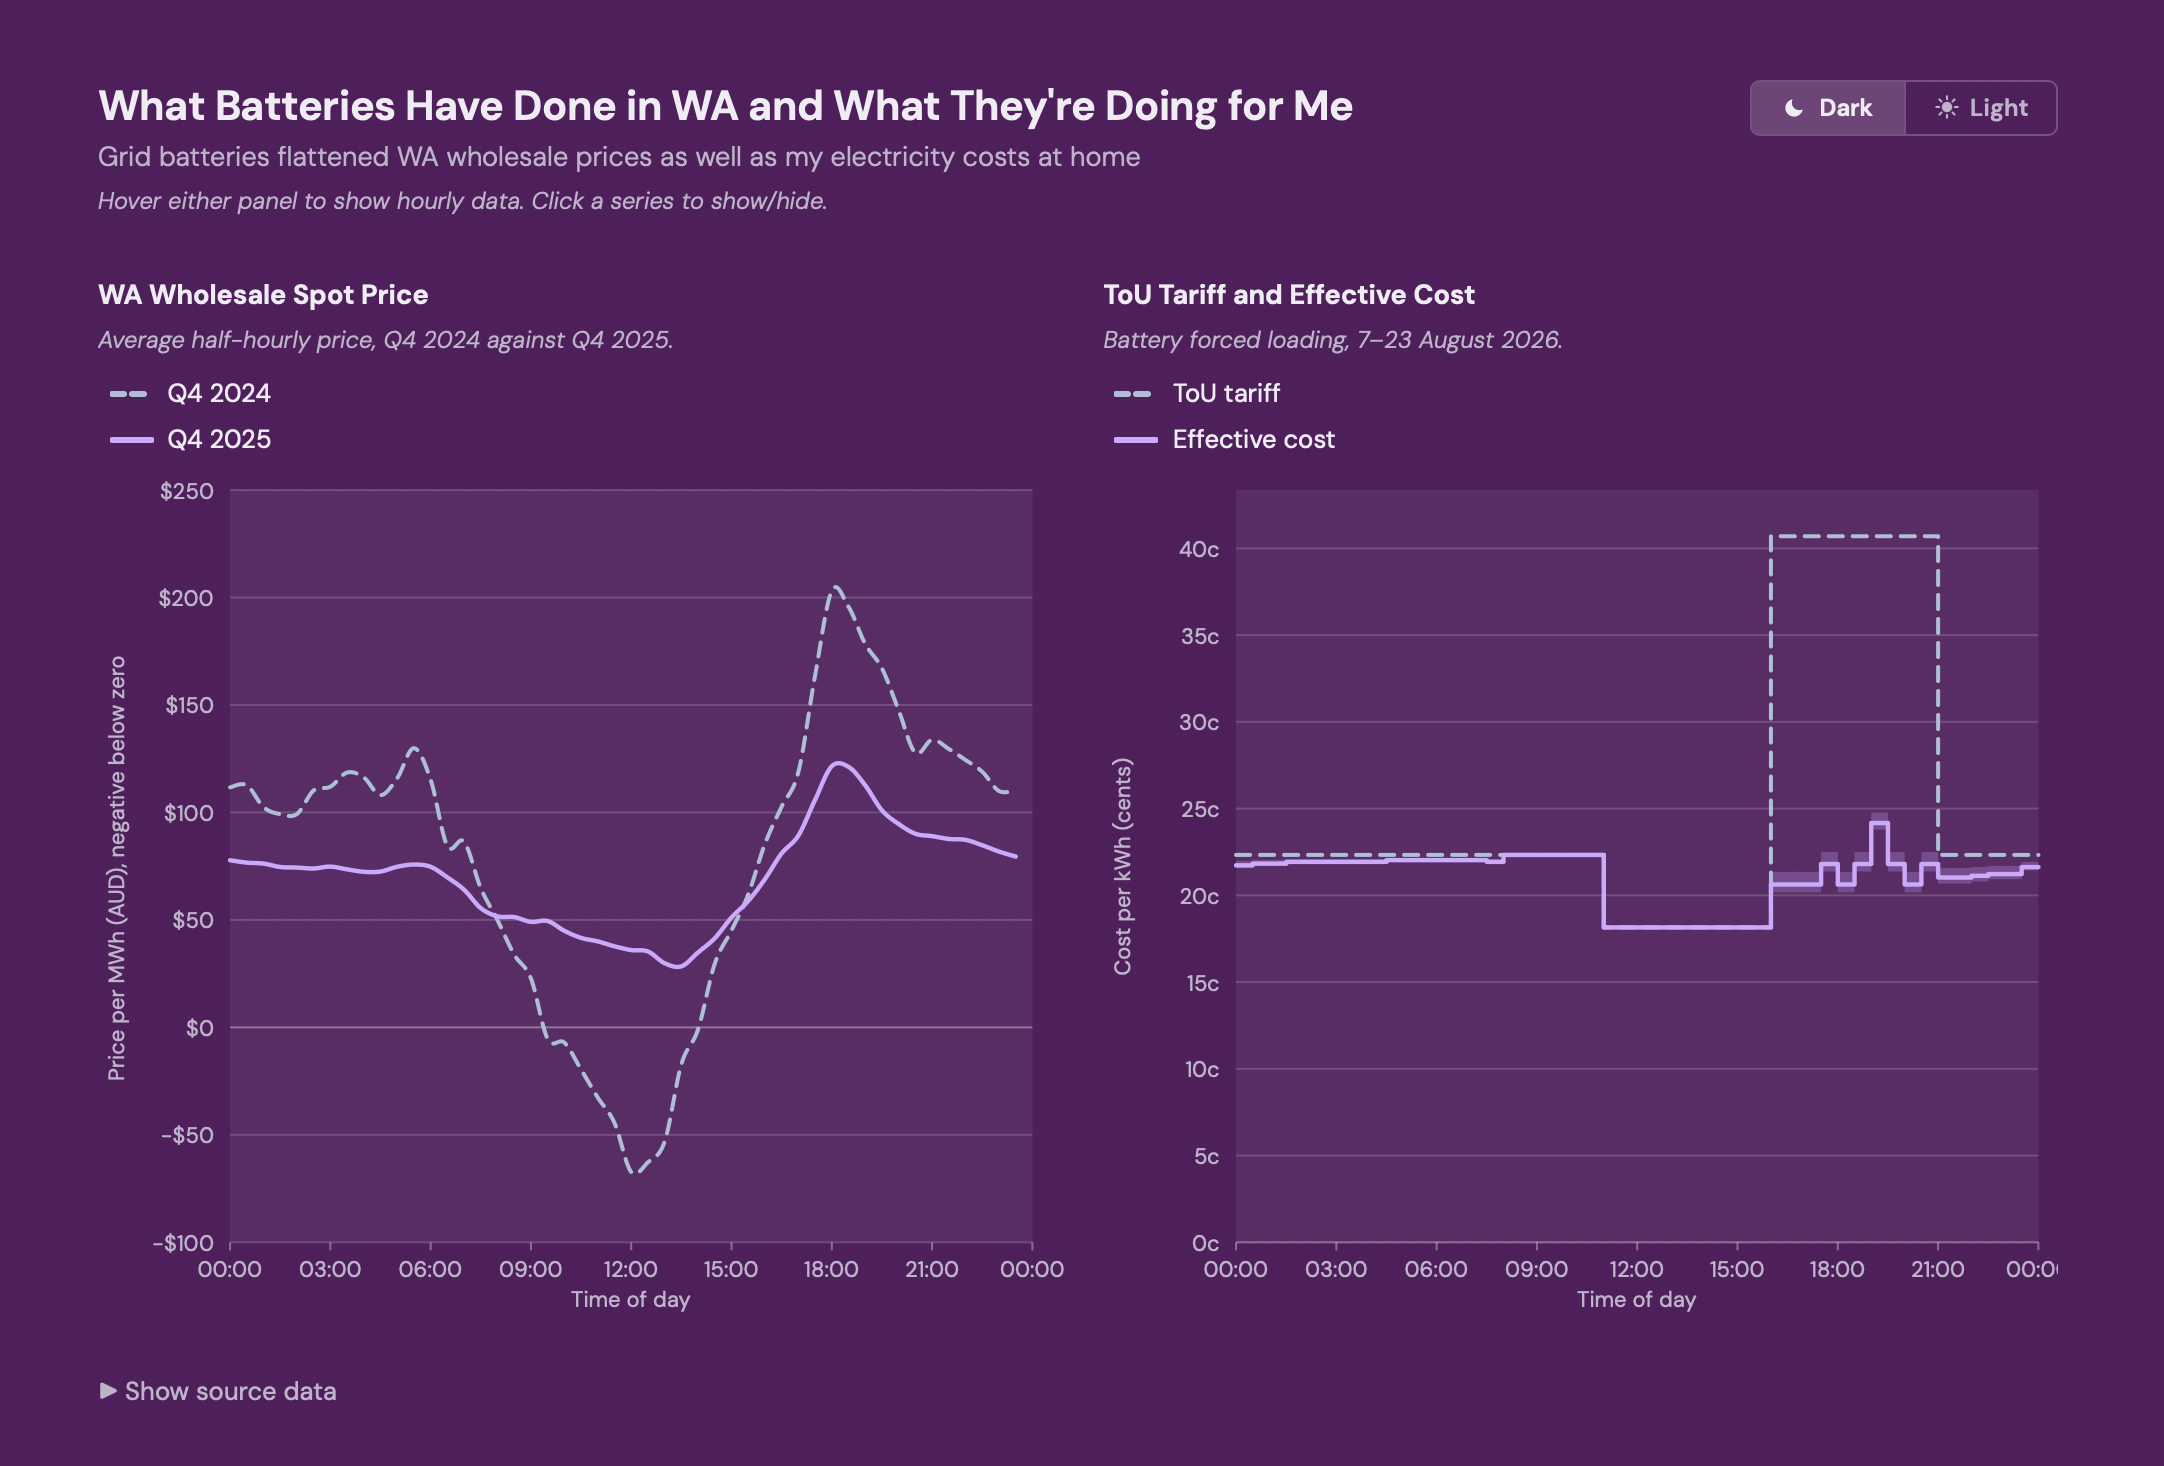
Flattening the (ToU) Curve
This is part of my Home Decarbonisation Project and is going to be another one of those article response posts, but this time I’ll be brief. What did you read this time? In an ABC article Watchdog circles WA utility as ‘unusual’ battery charging pushes prices higher they share a plot showing us how the…
Contact Me
Do you have questions about my home decarbonisation?